CUSTOMER STORY
High Impact Insights: Fast-Tracking Population Health

The Need
A health plan with 200K+ members aimed to improve clinical quality outcomes and optimize resource allocation amid its most vulnerable population by assessing gaps in quality, disease conditions, and social drivers to inform the development of personalized care planning programs.
Population Assessment: At What Cost?
Effective population assessment can require steep investment from health plans, including staff training and time as well as data management initiatives and solutions. It’s a complicated, ongoing process for many plans.
Key challenges include:
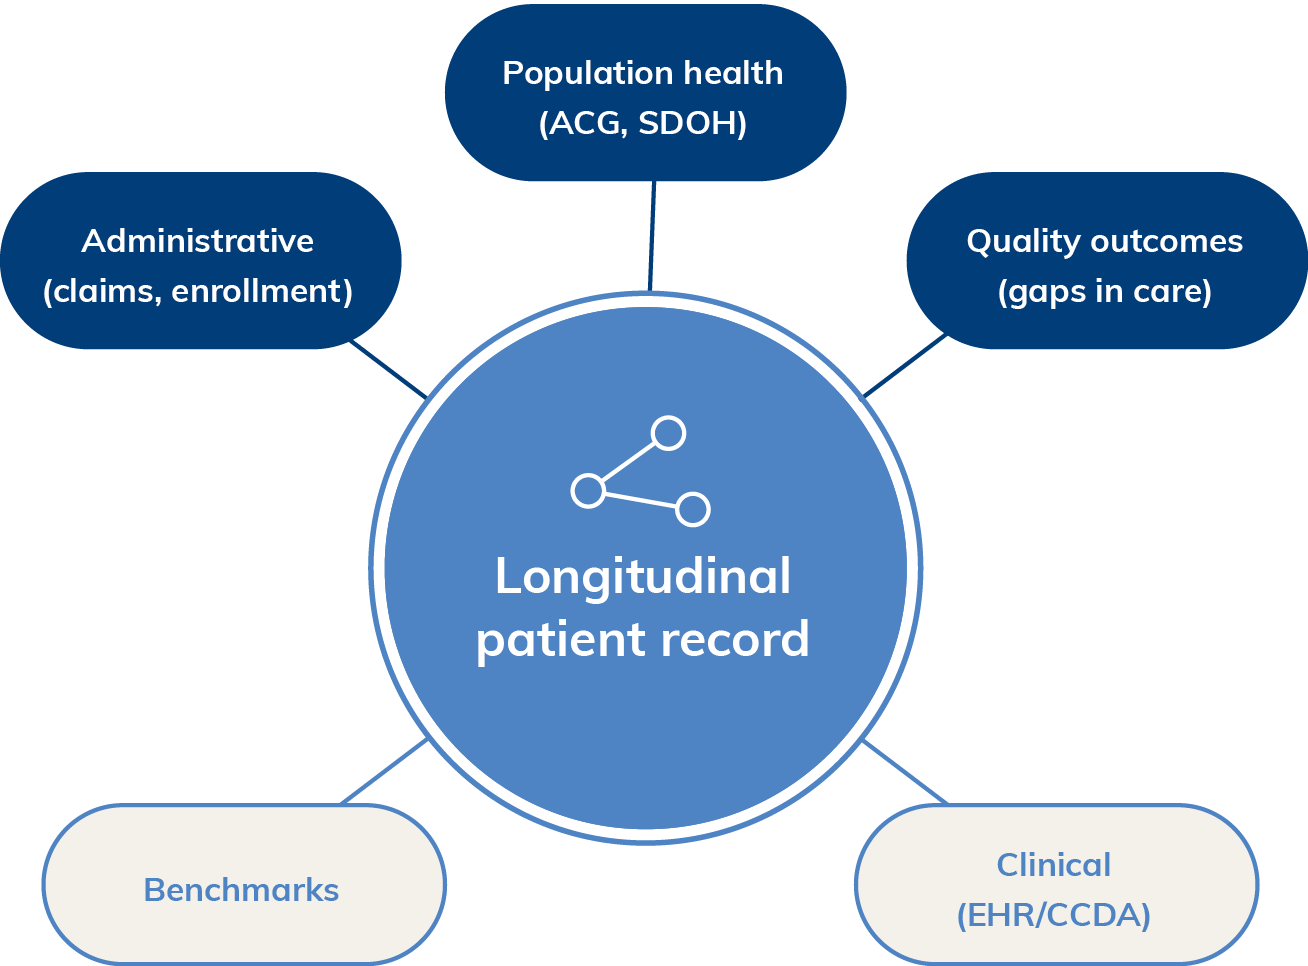
1. Combining and refreshing 8-10 data sources1
- Including administrative and EHR data, disease conditions, quality and documentation gaps, and supplemental data like social drivers of health (SDOH)
- This can be time-consuming to create and complex to manage
2. An investment of up to 18 months and $1.5 million for a 200k-member plan to2:
- Create a data warehouse bringing disparate data sources together
- Support build maintenance of comprehensive patient health profiles across member population
- According to NCQA’s Population Health Management Roadmap for Integrated Delivery Networks, “Data integrated from a variety of sources is the best way to get a full picture of a population and a true understanding of its characteristics and needs…Having a single location for aggregated data is important to population health management.” https://www.ncqa.org/ wp-content/uploads/2019/11/20191216_PHM_ Roadmap.pdf
- Time and cost calculations assume five to six engineers, two solution engineers, and two product analysts for a total of nine resources costing about $1.5M to work on building a data cloud platform capable of integrating various kinds of data sources (i.e., payer administrative raw data, analytics output data, cost and utilization output data, etc.). Two to three months is typical for analysts to understand the data models and perform analysis on the data.

8-10
Data sources needed
for population assessment

$1.5M
Investment to create and
maintain an in-house
data warehouse
A Smarter Solution
With Inovalon Healthcare Data Lake™, the health plan was able to achieve rapid integration and analysis of disparate data sources to deliver more comprehensive member profiles, more efficiently. Armed with the right technology, they empowered their care management teams to:
- Bring together multiple data sources and provide on-demand access to the data consumers within the health plan
- Rapidly identify the most vulnerable member populations
- Empower programs across the enterprise with up-to-date information upon each administrative data refresh
The Approach
Inovalon integrated medical and pharmacy claims with cost and other administrative data shared by the health plan. Modules were set up to analyze the data upon each customer data refresh, including:
- Quality and risk analytics to identify clinical quality and risk score accuracy gaps
- Johns Hopkins ACG model to identify disease conditions, utilization, ER visits, and hospitalizations
- Supplemental SDOH datasets to inform a comprehensive member profile
Analytics ran by Inovalon Healthcare Data Lake identified the health plan’s top 10% of members by utilization cost.
For these 10% of members, data on quality gaps, disease conditions, race, ethnicity, and a variety of SDOH factors (such as income and education) were quickly provided to the health plan.
The health plan identified two chronic disease conditions – Diabetes and Cardiovascular Disease – to target and were able to create comprehensive member profiles and individualized care plans for those members with open gaps.

Top 10%
of members identified

2
conditions selected to target
The Results
Within 60 days of data integration, the health plan received a rapid population assessment identifying the top 10% of members accounting for over 85% of total claim costs.
This group was:
- 3X more likely to visit the ER
- 40X more likely to be admitted to the hospital
Within this group:
- 70% had 2+ chronic conditions
- 50% had cardiovascular disease
- 50% had 5+ chronic conditions
- 20% were diagnoses with diabetes
To inform member engagement and intervention efforts, the analysis isolated where members in the top 10% resided, down to 9-digit ZIP codes, based on disease conditions, eligibility and gaps for quality measures, SDOH, cost profiles, ER visits, and hospitalizations.
Empower Your Care Management Programs with Actionable Data
Inovalon Healthcare Data Lake enables payers and provider organizations to quickly and easily create comprehensive member profiles and keep them refreshed month after month.
- Bring together multiple health plans’ claims, EHR data, and deidentified datasets
- Automatically refresh data every time you update your administrative datasets
- Connect with Inovalon analytics for quality and risk score accuracy gaps, Johns Hopkins ACG, and SDOH indicators
- Authorized users can easily access the latest version of data via a web interface