
INFOGRAPHIC
Medicare Advantage vs. Traditional Fee-for-Service: Different Populations; Different Outcomes
A summary of key findings using real-world data
New research from AHIP/BCBSA and Inovalon has found there is no evidence of favorable beneficiary selection into Medicare Advantage (MA). Compared to those enrolling in Fee-for-Service (FFS), beneficiaries entering MA are not healthier. MA enrollees have more chronic conditions (i.e., higher risk scores), and present with more social risk factors and higher costs.
After fully controlling for differences in who enrolls, including both clinical and social risk factors, FFS patients cost 11% more than similar enrollees in MA.
Why Now?
This study is a first-of-its-kind assessment of differences between MA and FFS enrollees, comprised of longitudinally linked data that connect beneficiaries’ health journeys from preMedicare and into Medicare.
The study strikes a sharp contrast to long-standing MedPAC reporting of favorable selection into MA and has significant policy implications. By evaluating diagnoses and characteristics of beneficiaries while they were enrolled in commercial or Medicaid insurance plans before enrolling in Medicare, we are able to remove biases resulting from differential selection or differences in coding of chronic conditions.
This overcomes a major limitation in the MedPAC analysis that only looked at Medicare beneficiaries who switch from FFS to MA after enrollment to simulate differences in program effectiveness. That approach does not control for differences in who enrolls in each program. Our analysis compares matched cohorts of beneficiaries in MA and FFS.
Data and Methods
Inovalon linked commercial, MA, and FFS data to control for enrollment, diagnosis, and treatment histories. The data was then linked to near-neighborhood social drivers of health (SDOH) characteristics.

The MORE2 Registry®
Inovalon’s primary source real-world dataset was used to construct enrollment, diagnosis, and treatment histories for individuals who were enrolled in a commercial or Medicaid plan before enrolling in Medicare. These pre-enrollment characteristics were used to create matched cohorts of beneficiaries who enrolled in MA or FFS.

Medicare FFS Claims for Parts A, B, and D
Inovalon linked the cohort of individuals who enrolled in FFS to data from 100% Medicare FFS claims accessed through a research Data Use Agreement with CMS.

Inovalon’s SDOH Data Warehouse
Inovalon linked Medicare enrollees to our near-neighborhood dataset of characteristics such as income, educational attainment, living situation, English language proficiency, transportation, housing, and other SDOH.
With this extensive dataset of pre- and post-Medicare enrollment, this study analyzed outcomes during the three years before enrollment and the two years after enrollment.
After controlling for differences in demographic, clinical, and socioeconomic characteristics of Medicare enrollees based on pre-enrollment data, the study compared:

Healthcare use and cost

Quality outcomes
Key Finding:
MA Enrollees Are Less Healthy Before They Enroll in Medicare
MA enrollees are more medically vulnerable than FFS enrollees.
There is favorable selection into FFS (not MA), when using real-world data.
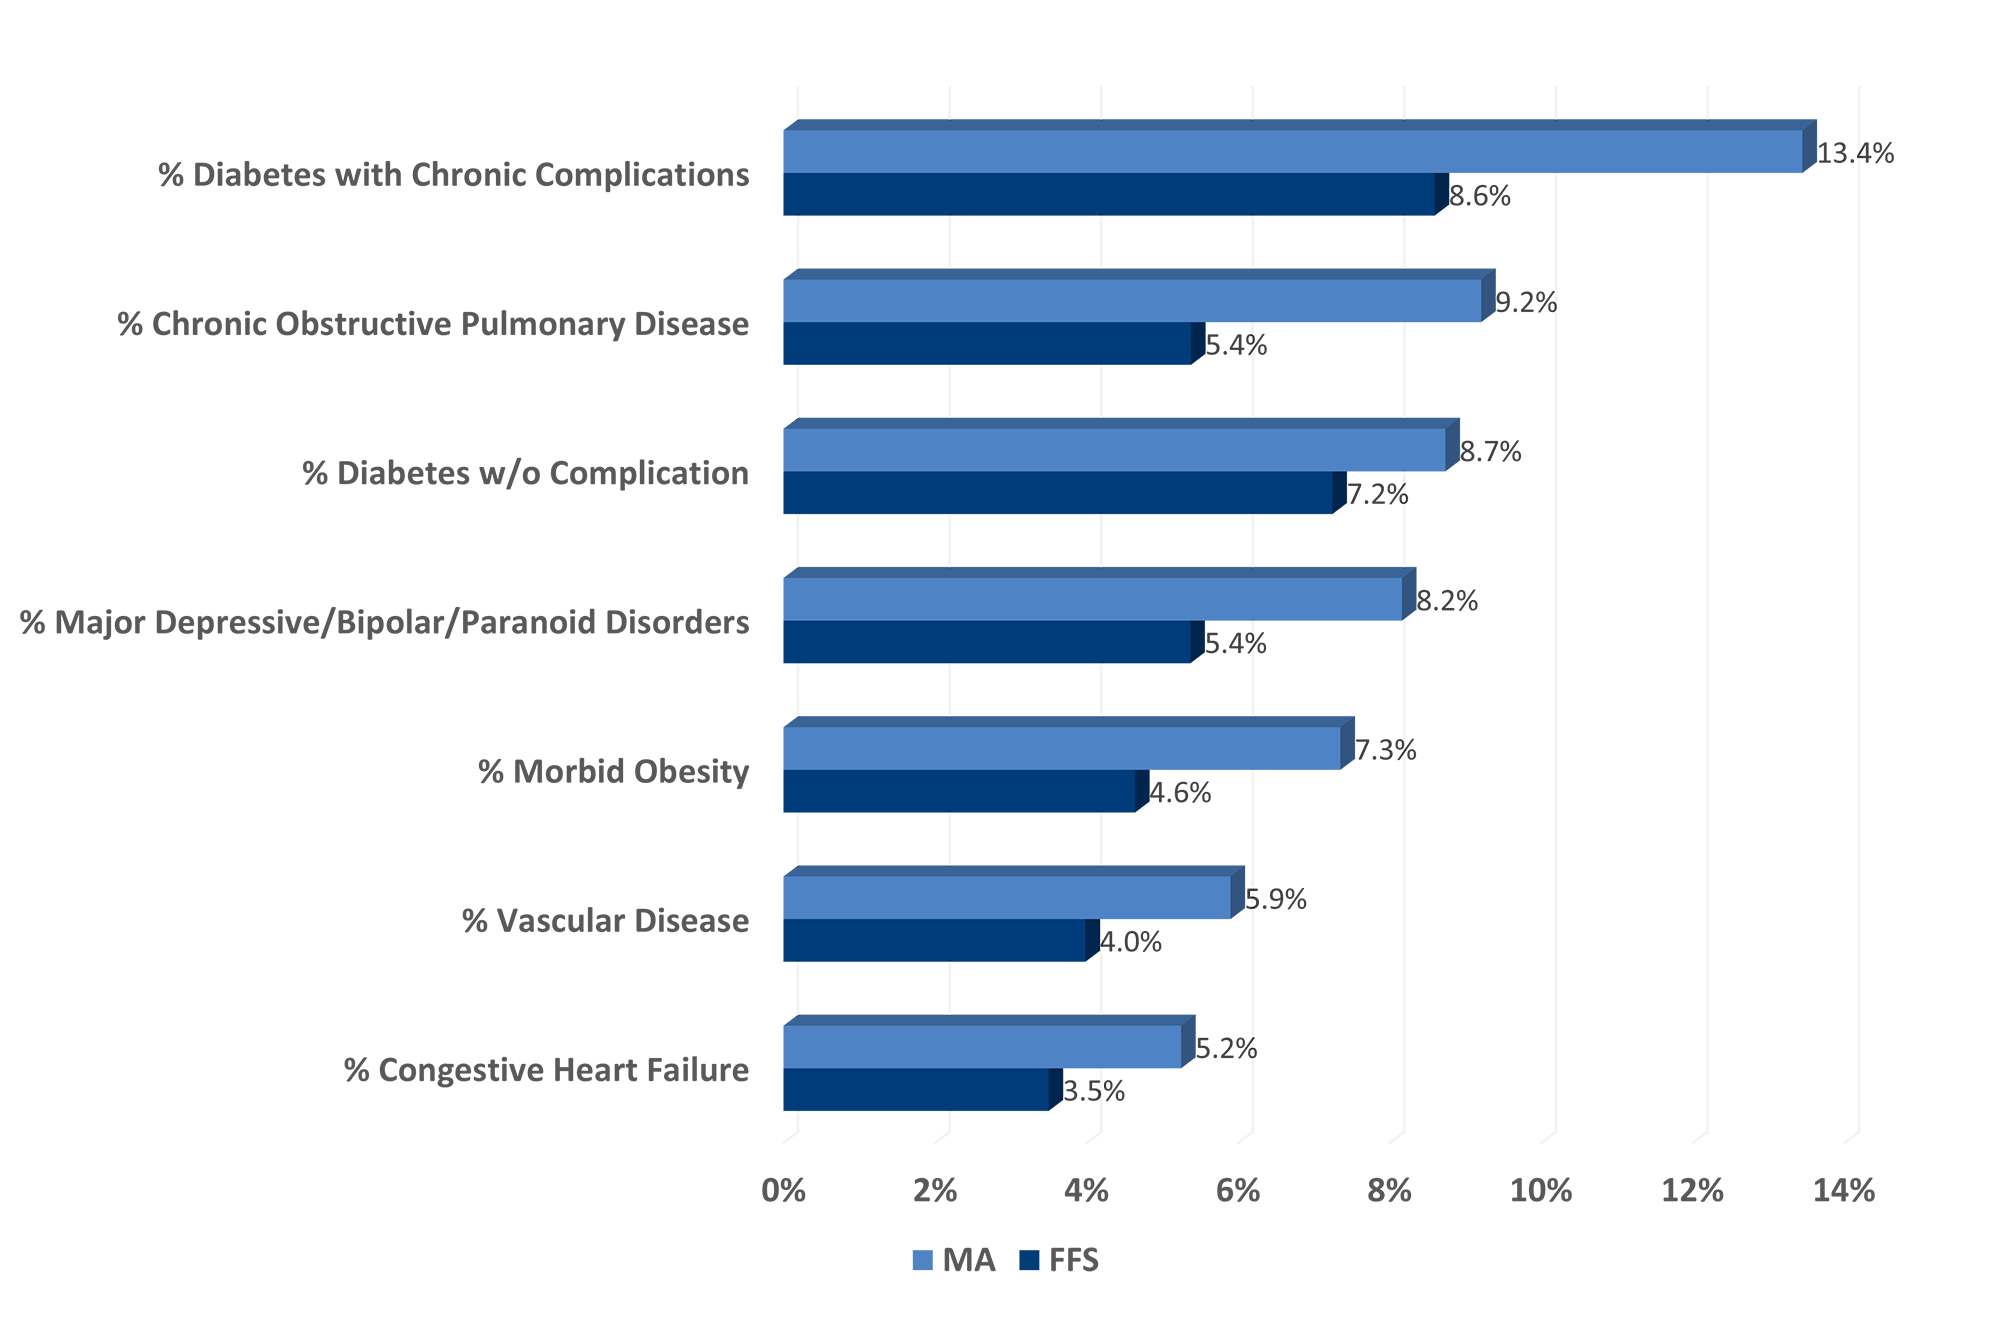
Additionally, beneficiaries who enroll in MA are:

1.3x
70%
Key Finding:
MA Enrollees Are More Socially Vulnerable
Those enrolling in MA are more likely to have social risk factors that are found to be associated with higher healthcare use and costs.
MA has 1.6x more enrollees with incomes under $50,000/yr
MA enrollees are twice as likely to have Medicaid insurance (rather than commercial) before enrolling in Medicare
MA has 1.7x more racial/ethnic minorities than FFS
Key Finding:
MA Enrollees Are Less Healthy Before They Enroll in Medicare
Before enrollment:
MA enrollees have higher HCC risk scores on average prior to Medicare enrollment.
- HCC risk score = 0.682 among those enrolling in MA
- HCC risk score = 0.607 among those enrolling in FFS
Risk-standardized costs* are 1% higher before Medicare enrollment for those enrolling in MA compared to those who enroll in FFS ($1,200 PPPM [per patient per month] vs. $1,184 PPPM).

After enrollment:
After fully controlling for differences in who enrolls (i.e., clinical, demographic, and social risk factors), FFS patients cost 11% more than similar enrollees in MA.
Risk-standardized costs that control only for prevalence of chronic conditions (and not for demographic or social risk as above) are 9% lower overall for those enrolling in MA vs. FFS.
FFS beneficiaries with similar risk scores and similar demographic and social risk factors would incur 11% lower costs if they switched to MA.
Overall, the study finds MA is providing more efficient care for beneficiaries with similar risk levels.

FFS has 52% higher ED visits

FFS enrollees are 40% more likely to have been hospitalized

FFS has 30% more hospital days

FFS has 126% higher 30-day readmissions

FFS has 11% higher total costs

FFS has 53% higher inpatient costs

FFS has 71% more preventable hospitalizations
A New, Closer Look at MA vs. FFS
The importance of controlling for differences in who enrolls, including clinical, demographic, and socioeconomic factors, provides a more accurate picture based on real-world data when comparing cost and utilization between MA and FFS.
The findings from this unique analysis of beneficiaries before and after they enroll in Medicare challenge long-standing assumptions about the value of MA compared to traditional FFS Medicare. These findings have far-reaching implications for healthcare stakeholders and may influence future policy decisions related to funding and risk adjustment models – a potential significant step forward in healthcare’s ongoing Medicare program design shift toward value-based care
Learn more about this study’s methodology, data sources, and findings.
*Risk Standardized Cost = PMPM cost during 1 year prior to Medicare enrollment while insured by a commercial or Medicaid plan / Mean HCC risk score pre-enrollment
All findings shown here are from recent Inovalon research: “Medicare Advantage vs. Traditional Fee-for-Service Medicare: Different Populations, Different Outcomes,” Christie Teigland, Ph.D., Scott Bilder, Ph.D.,
Inovalon, May 2025, https://www.inovalon.com/resource/ma-vs-traditional-ffs-medicare-different-populations-different-outcomes/
Inovalon and design® and Inovalon® are trademarks of Inovalon, Inc.


