

SAFETY EVENT REPORTING

VigiLanz Safety Management

Prevent harm, protect patients, and stay compliant with near real-time safety event reporting.

Request A Demo

Proactive Safety Starts Here

When safety slips through the cracks it’s not just compliance at stake – it’s trust, patient outcomes, and your team’s ability to prevent harm. This safety event reporting software helps you take control with fewer clicks and near real-time insights that transform teams from reaction to prevention. Choose from three tiers to match your safety goals and team’s needs.

For Post-Acute Facilities

A diagram of five interconnected blue gear icons, linked by straight and dotted lines, illustrates a Safety Event Reporting process or workflow on a light gray background.

Safety Management Starter

Catch and track safety events with user-friendly safety event reporting that helps teams respond faster and reduce the chance of risk slipping through the cracks.

For Acute and Ambulatory Facilities

Simple blue outline of an eye with a circle and line inside the pupil, surrounded by evenly spaced dashed lines forming a larger circle—an ideal icon for Safety Event Reporting—on a light gray background.

VigiLanz Safety Management

Route events automatically, flag critical issues, and give teams the insights they need to dig deeper, respond quicker, and build a culture of accountability.

For Acute and Ambulatory Facilities

A blue outline of a shield with a checkmark inside a circle in the center, symbolizing Safety Event Reporting and protection, on a light gray background.

VigiLanz Safety Management Pro

Unlock automated event detection and deeper analytics to catch hidden risks early, improve response times, and support strategic, system-wide safety improvements.

For Post-Acute Facilities

Inovalon's Safety Management StarterTM

Achieve stronger performance with less manual work. This starter solution helps you reduce risk, improve documentation, and stay ready for audits so your team can focus on care, not chasing paperwork.

A blue line graph and bar chart with a magnifying glass overlaid, symbolizing data analysis or analytics on a light background.

Lower Risk and Liability

Capture the right details from the start with guided reporting, root cause prompts, and trend tracking to drive a timely, targeted response.

Simple illustration of an open hand holding a coin with a dollar sign symbol, representing money, payment, or financial support.

Cut Costs With Better Documentation

Simplified investigations support improved outcomes and may help lower insurance premiums with cleaner, more complete reporting.

Illustration of a clock with speed lines trailing behind it, symbolizing the quick passage of time—perfect for representing a fast Clinical Trial Solution. The clock has simple black hands and marks on a light background.

Save Time and Surface Trends

Auto-tag and route incidents by type, then send targeted reports to the right teams – no manual sorting or searching required.

A blue check mark inside a blue circle on a light, gradient background.

Stay Ready for Surveys and Audits

Control documentation during discovery, respond quickly to F-689 issues, and keep your risk data organized and accessible.

For Acute and Ambulatory Facilities

Inovalon's VigiLanz Safety ManagementTM

Take control of safety across your organization with reports and analytics that help your team act faster, uncover root causes, and better prevent repeat harm. Designed for busy care environments, this tier delivers near real-time alerts and automated workflows to drive meaningful improvements.

Simple illustration of a computer monitor displaying several check marks and horizontal lines, representing completed tasks or a checklist on a screen.

Make Reporting Fast and Frictionless

Cut down on clicks and delays with pre-filled forms, guided workflows, and automatic routing to the right person.

Simple line drawing of a magnifying glass focusing on a map location pin, symbolizing search or navigation.

See What Went Wrong

Built-in tools like fishbone diagrams and the 5 Whys help teams connect the dots and take action to prevent repeated and future harm.
A simple illustration of a pie chart and a bar graph, both in blue with light gradient shading, representing data analysis or statistics on a light gray background.

Spot Patterns Before They Escalate

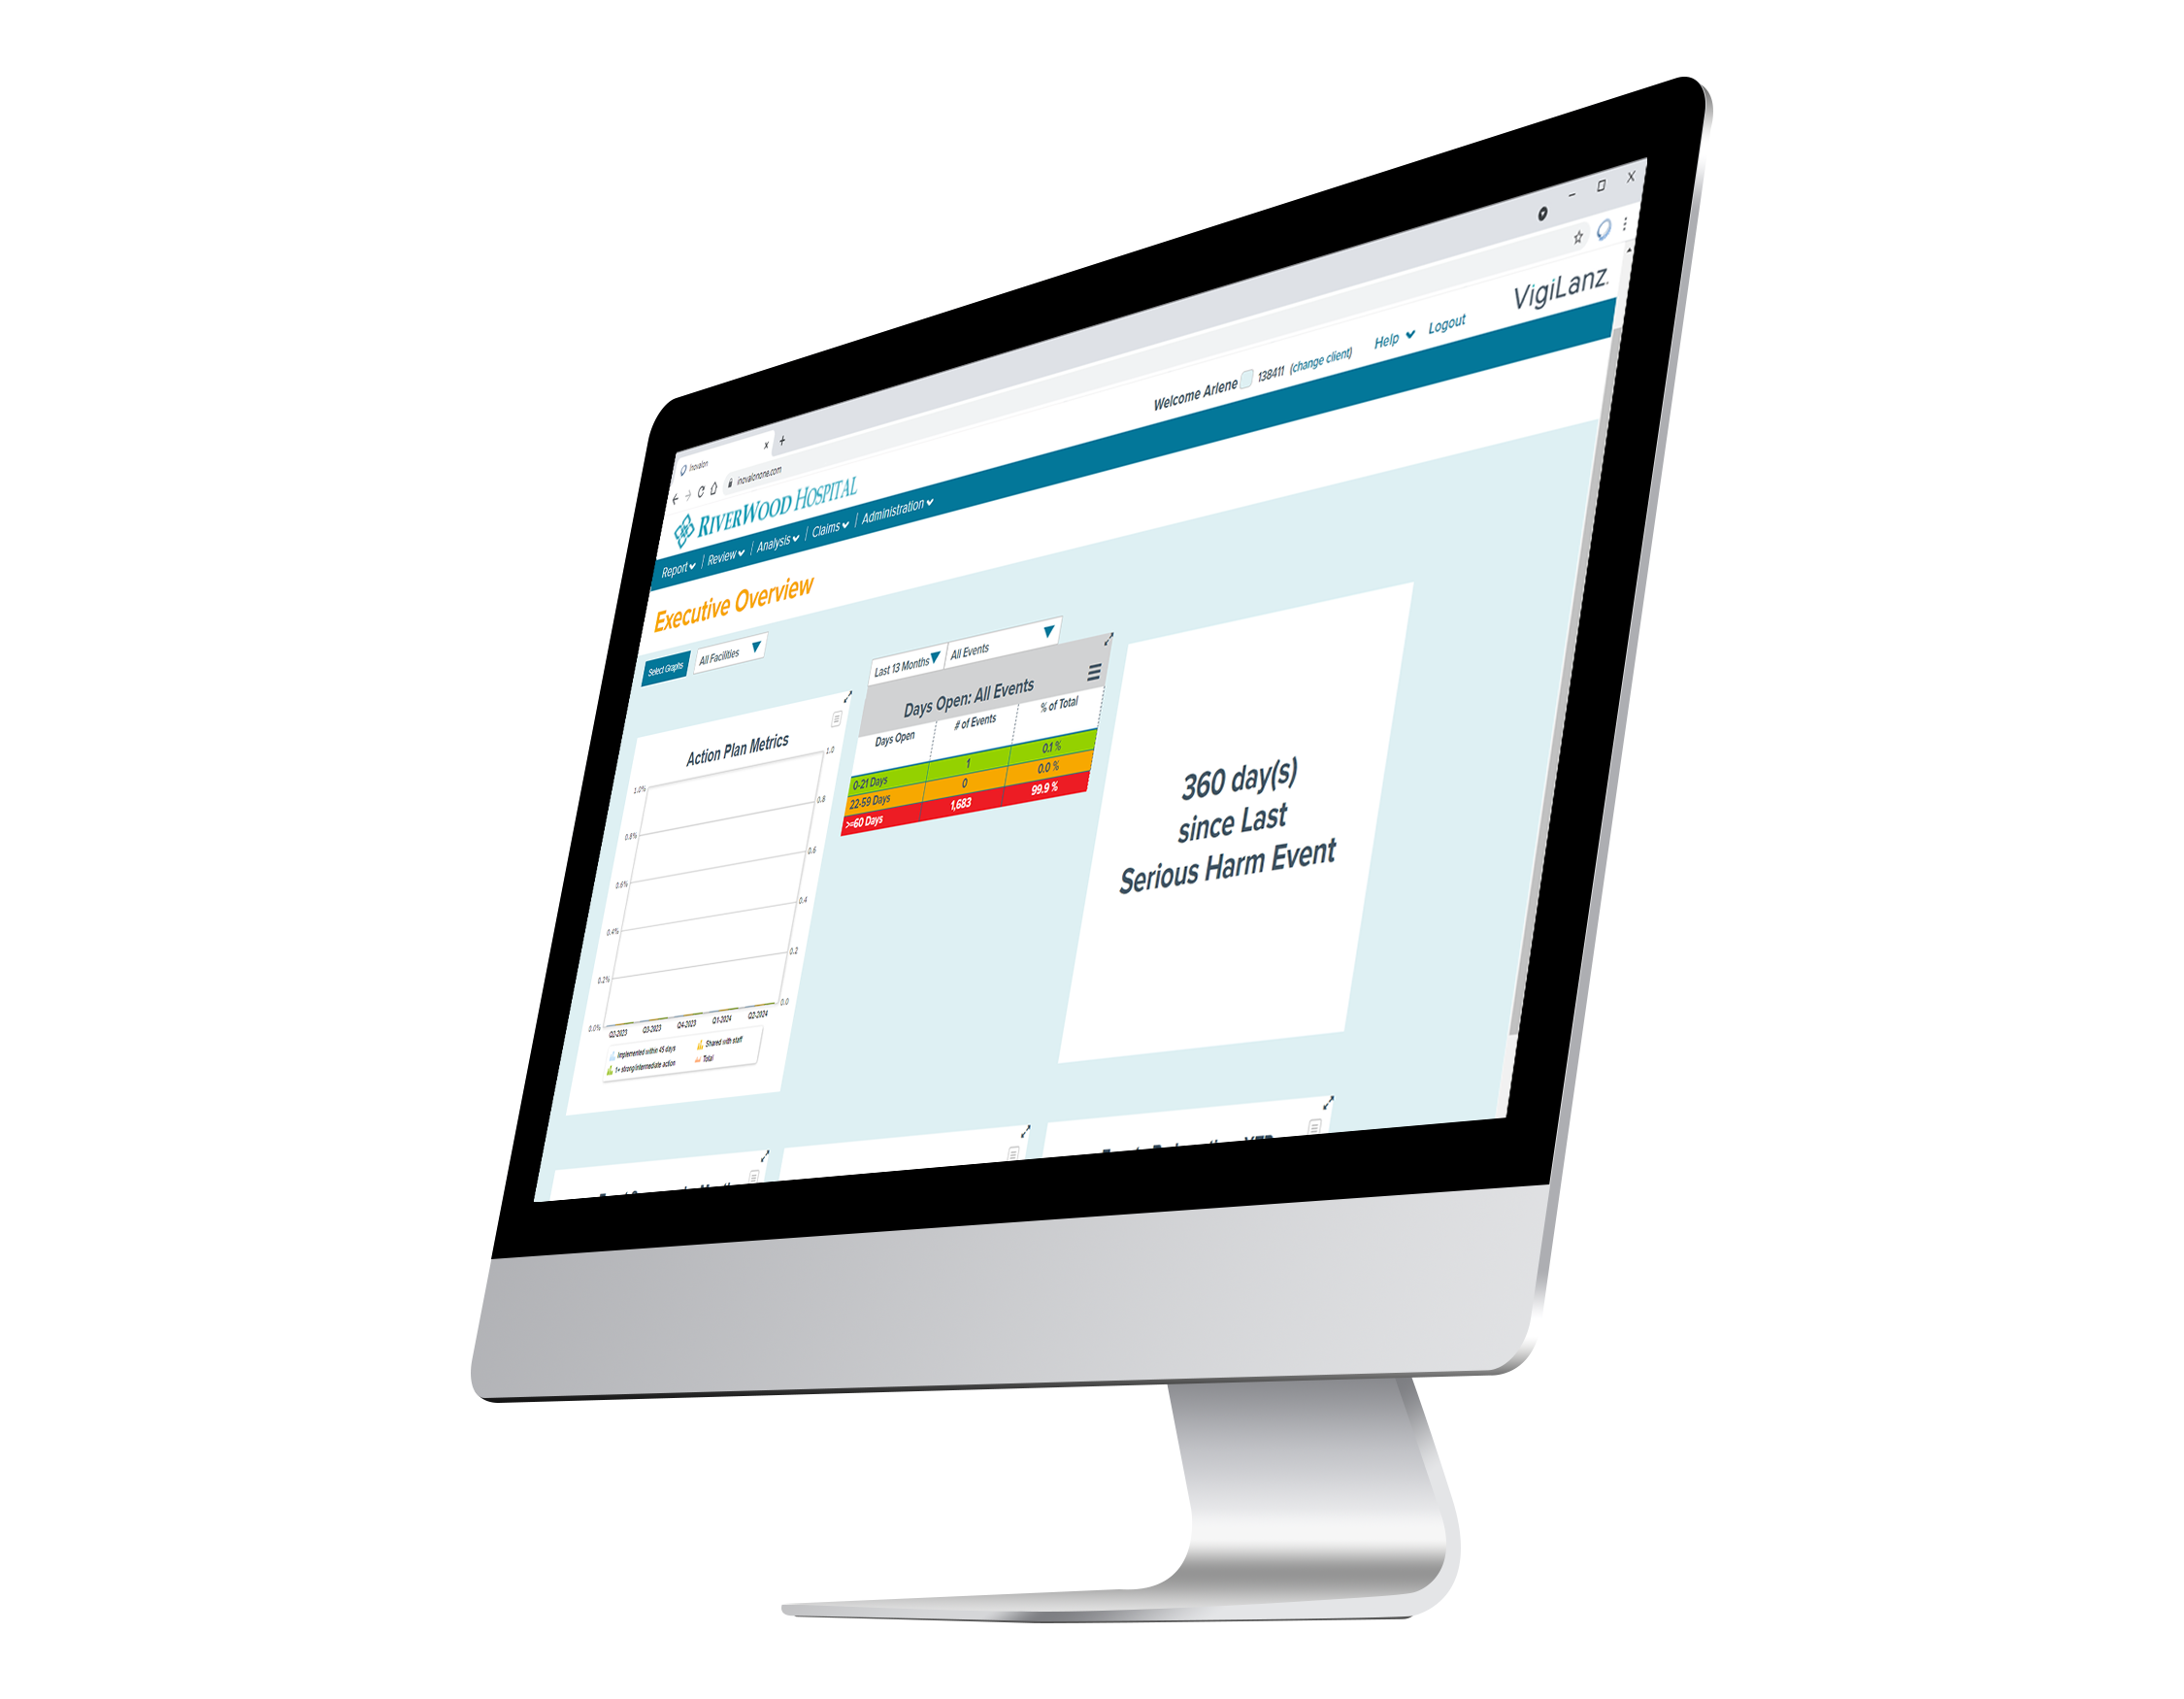
Near real-time dashboards give leaders a clearer view of safety trends and where to focus next.

A simple illustration of an open hand facing upward with a heart shape floating above it, symbolizing care, support, or giving. The design uses blue outlines with a light gradient in the heart.

Strengthen Trust and Transparency

Support a stronger safety culture by making reporting easier and showing staff their voices lead to action.

For Acute and Ambulatory Facilities

Inovalon's VigiLanz Safety Management ProTM

Take your safety oversight to the next level. This tier adds advanced capabilities that help your team uncover hidden risks, track feedback at scale, and make smarter, data-informed decisions for stronger outcomes.
A computer monitor displaying a warning triangle with an exclamation mark in the center, indicating an error or alert message. The illustration uses simple blue and beige lines.

Detect What Others Miss

Automatically surface potential safety incidents that may have gone unreported, so nothing gets overlooked.

A magnifying glass highlighting the center figure among three outlined people, symbolizing search, selection, or recruitment.

Act on Patient Feedback Faster

Track, manage, and respond to patient and visitor concerns while spotting trends that impact satisfaction and recovery.

A blue bar chart with five vertical bars of increasing height and a line graph with four circular markers connecting the tops, illustrating upward growth or a positive trend in a Clinical Trial Solution.

Extract the Data That Matters

Access safety, event, and action plan data in a format that supports internal tracking and external reporting.

Illustration of a medical clipboard with a plus sign, checklist items, and a shield with a checkmark, symbolizing healthcare or medical insurance informed by Real World Data.

Configure Without Limits

Create as many event forms as your organization needs, all tailored to your workflows, teams, and evolving priorities.

25

Of the top U.S. 25 health systems use Inovalon solutions1

90%

YOY customer satisfaction rate2

50,000+

Active, licensed customers3
HOW IT WORKS

Track, Manage, and Analyze Safety Incidents From Beginning to End

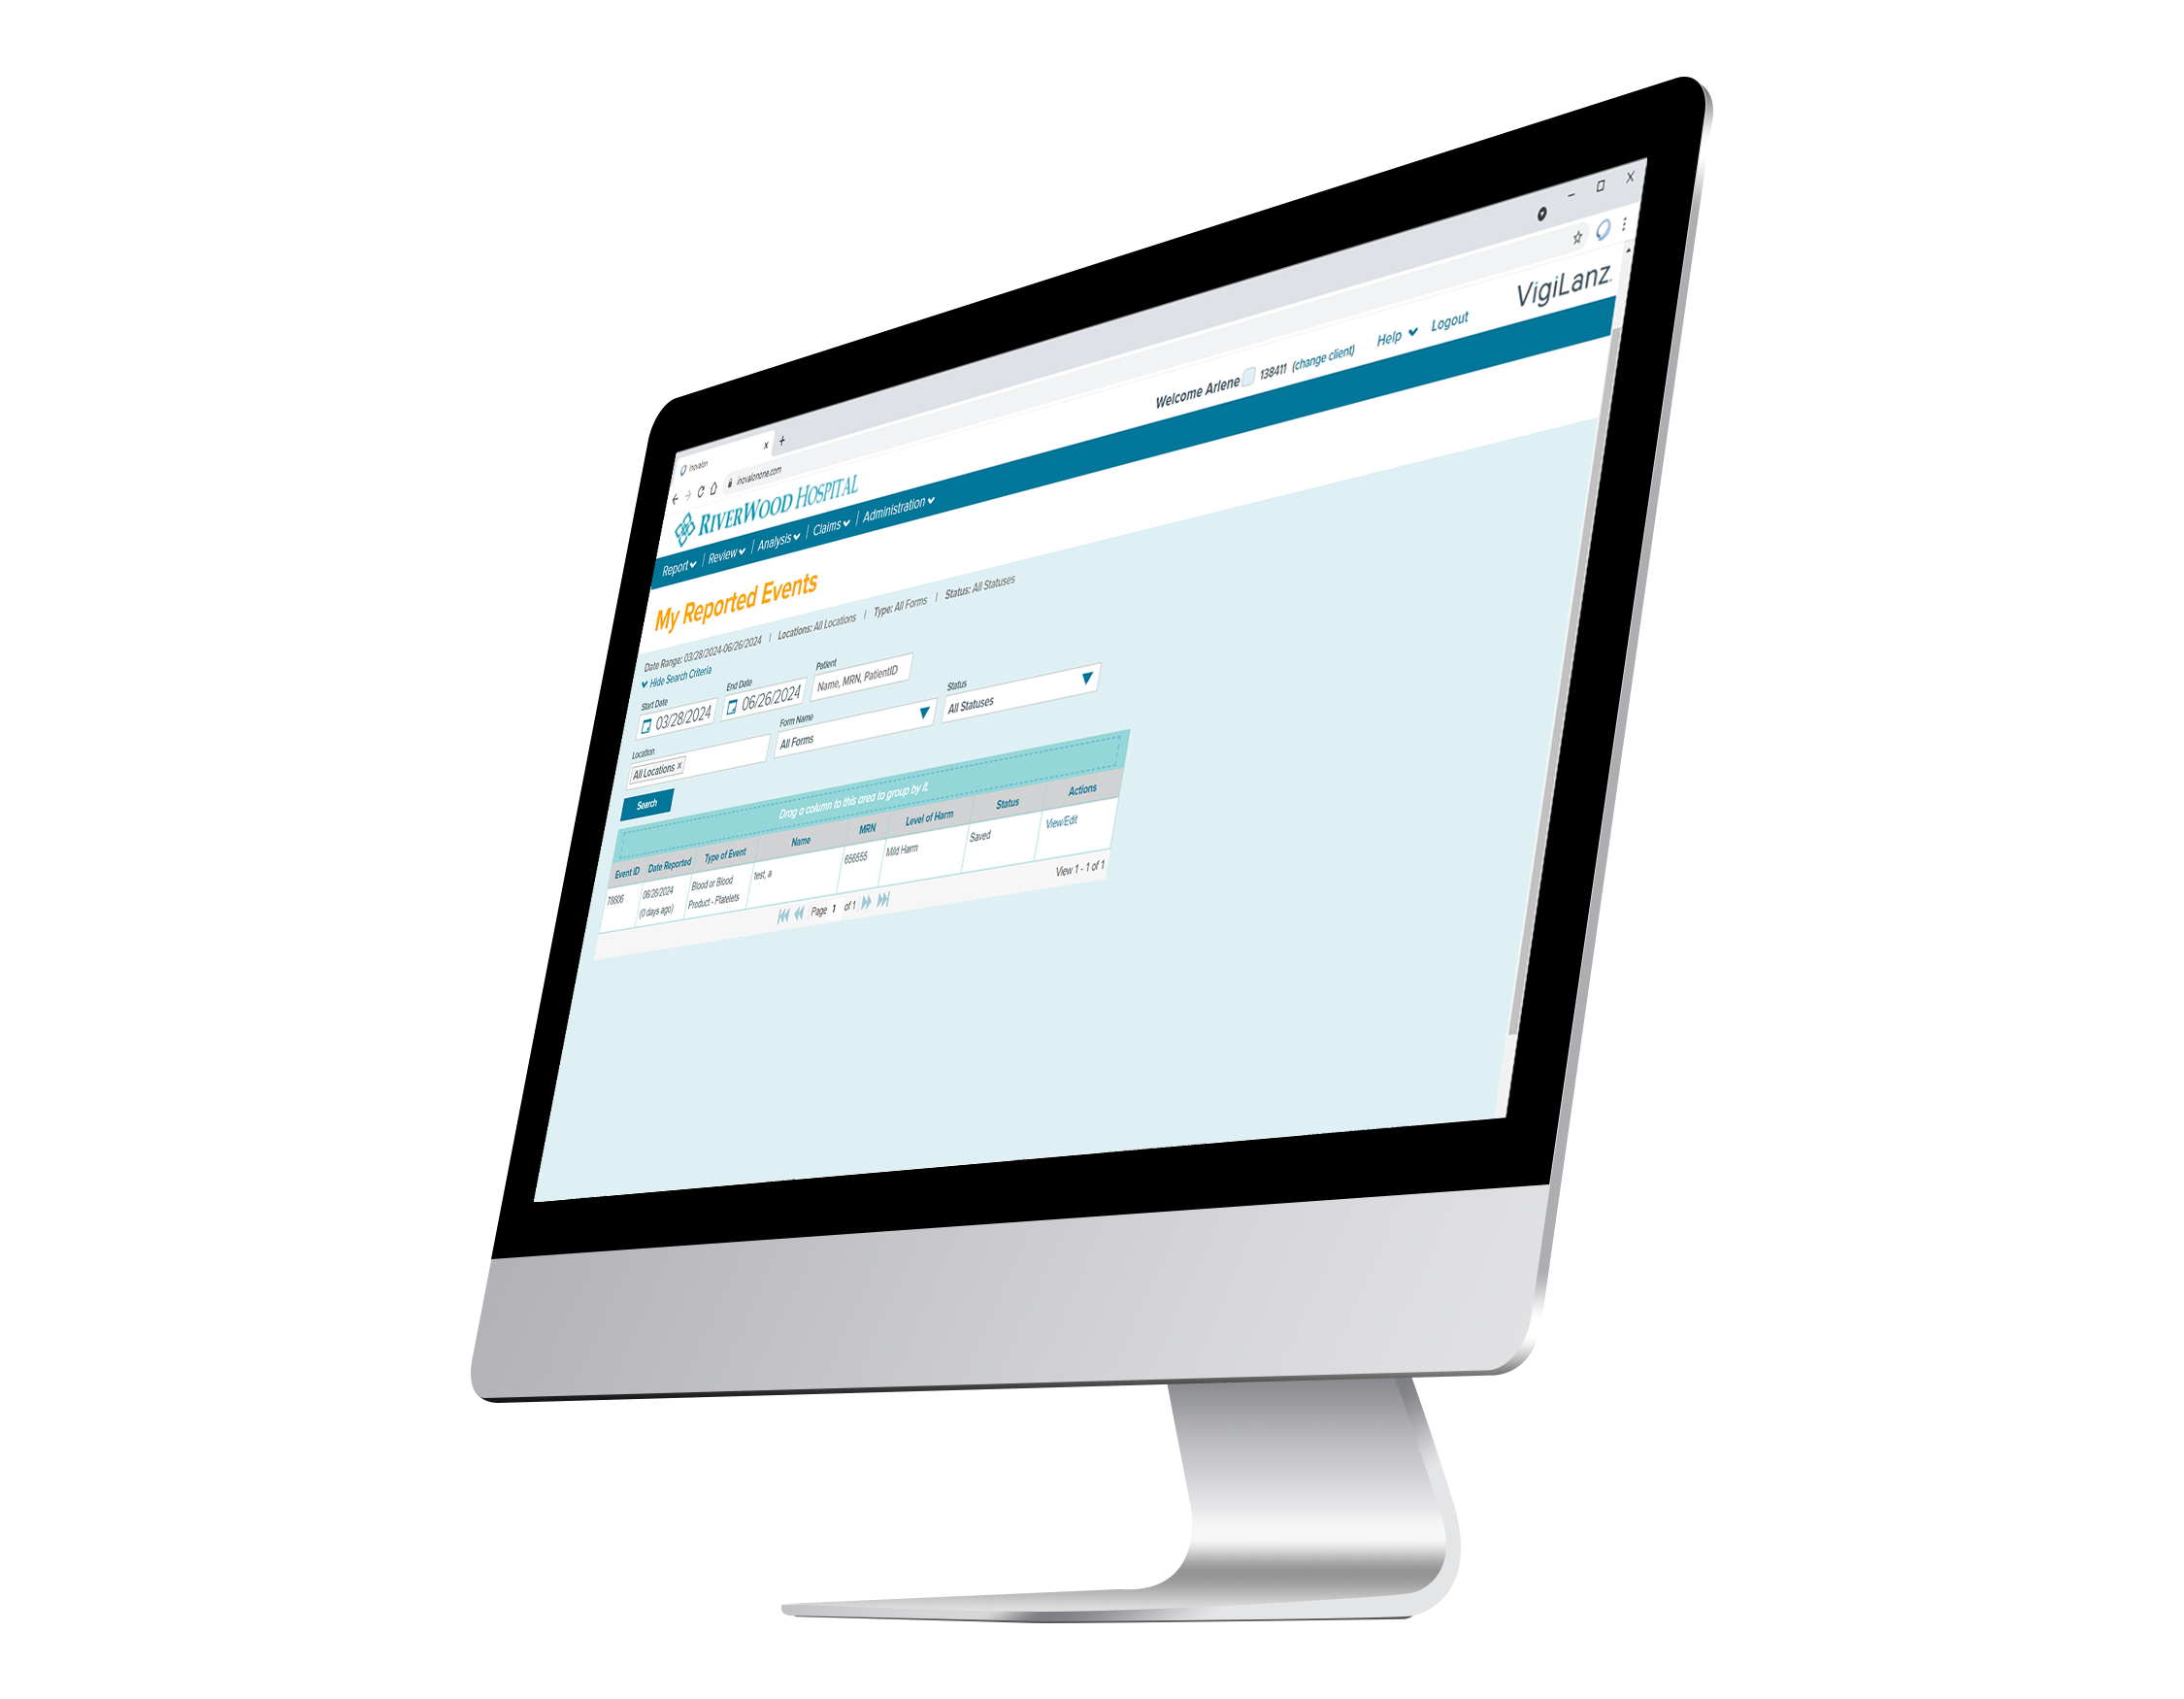
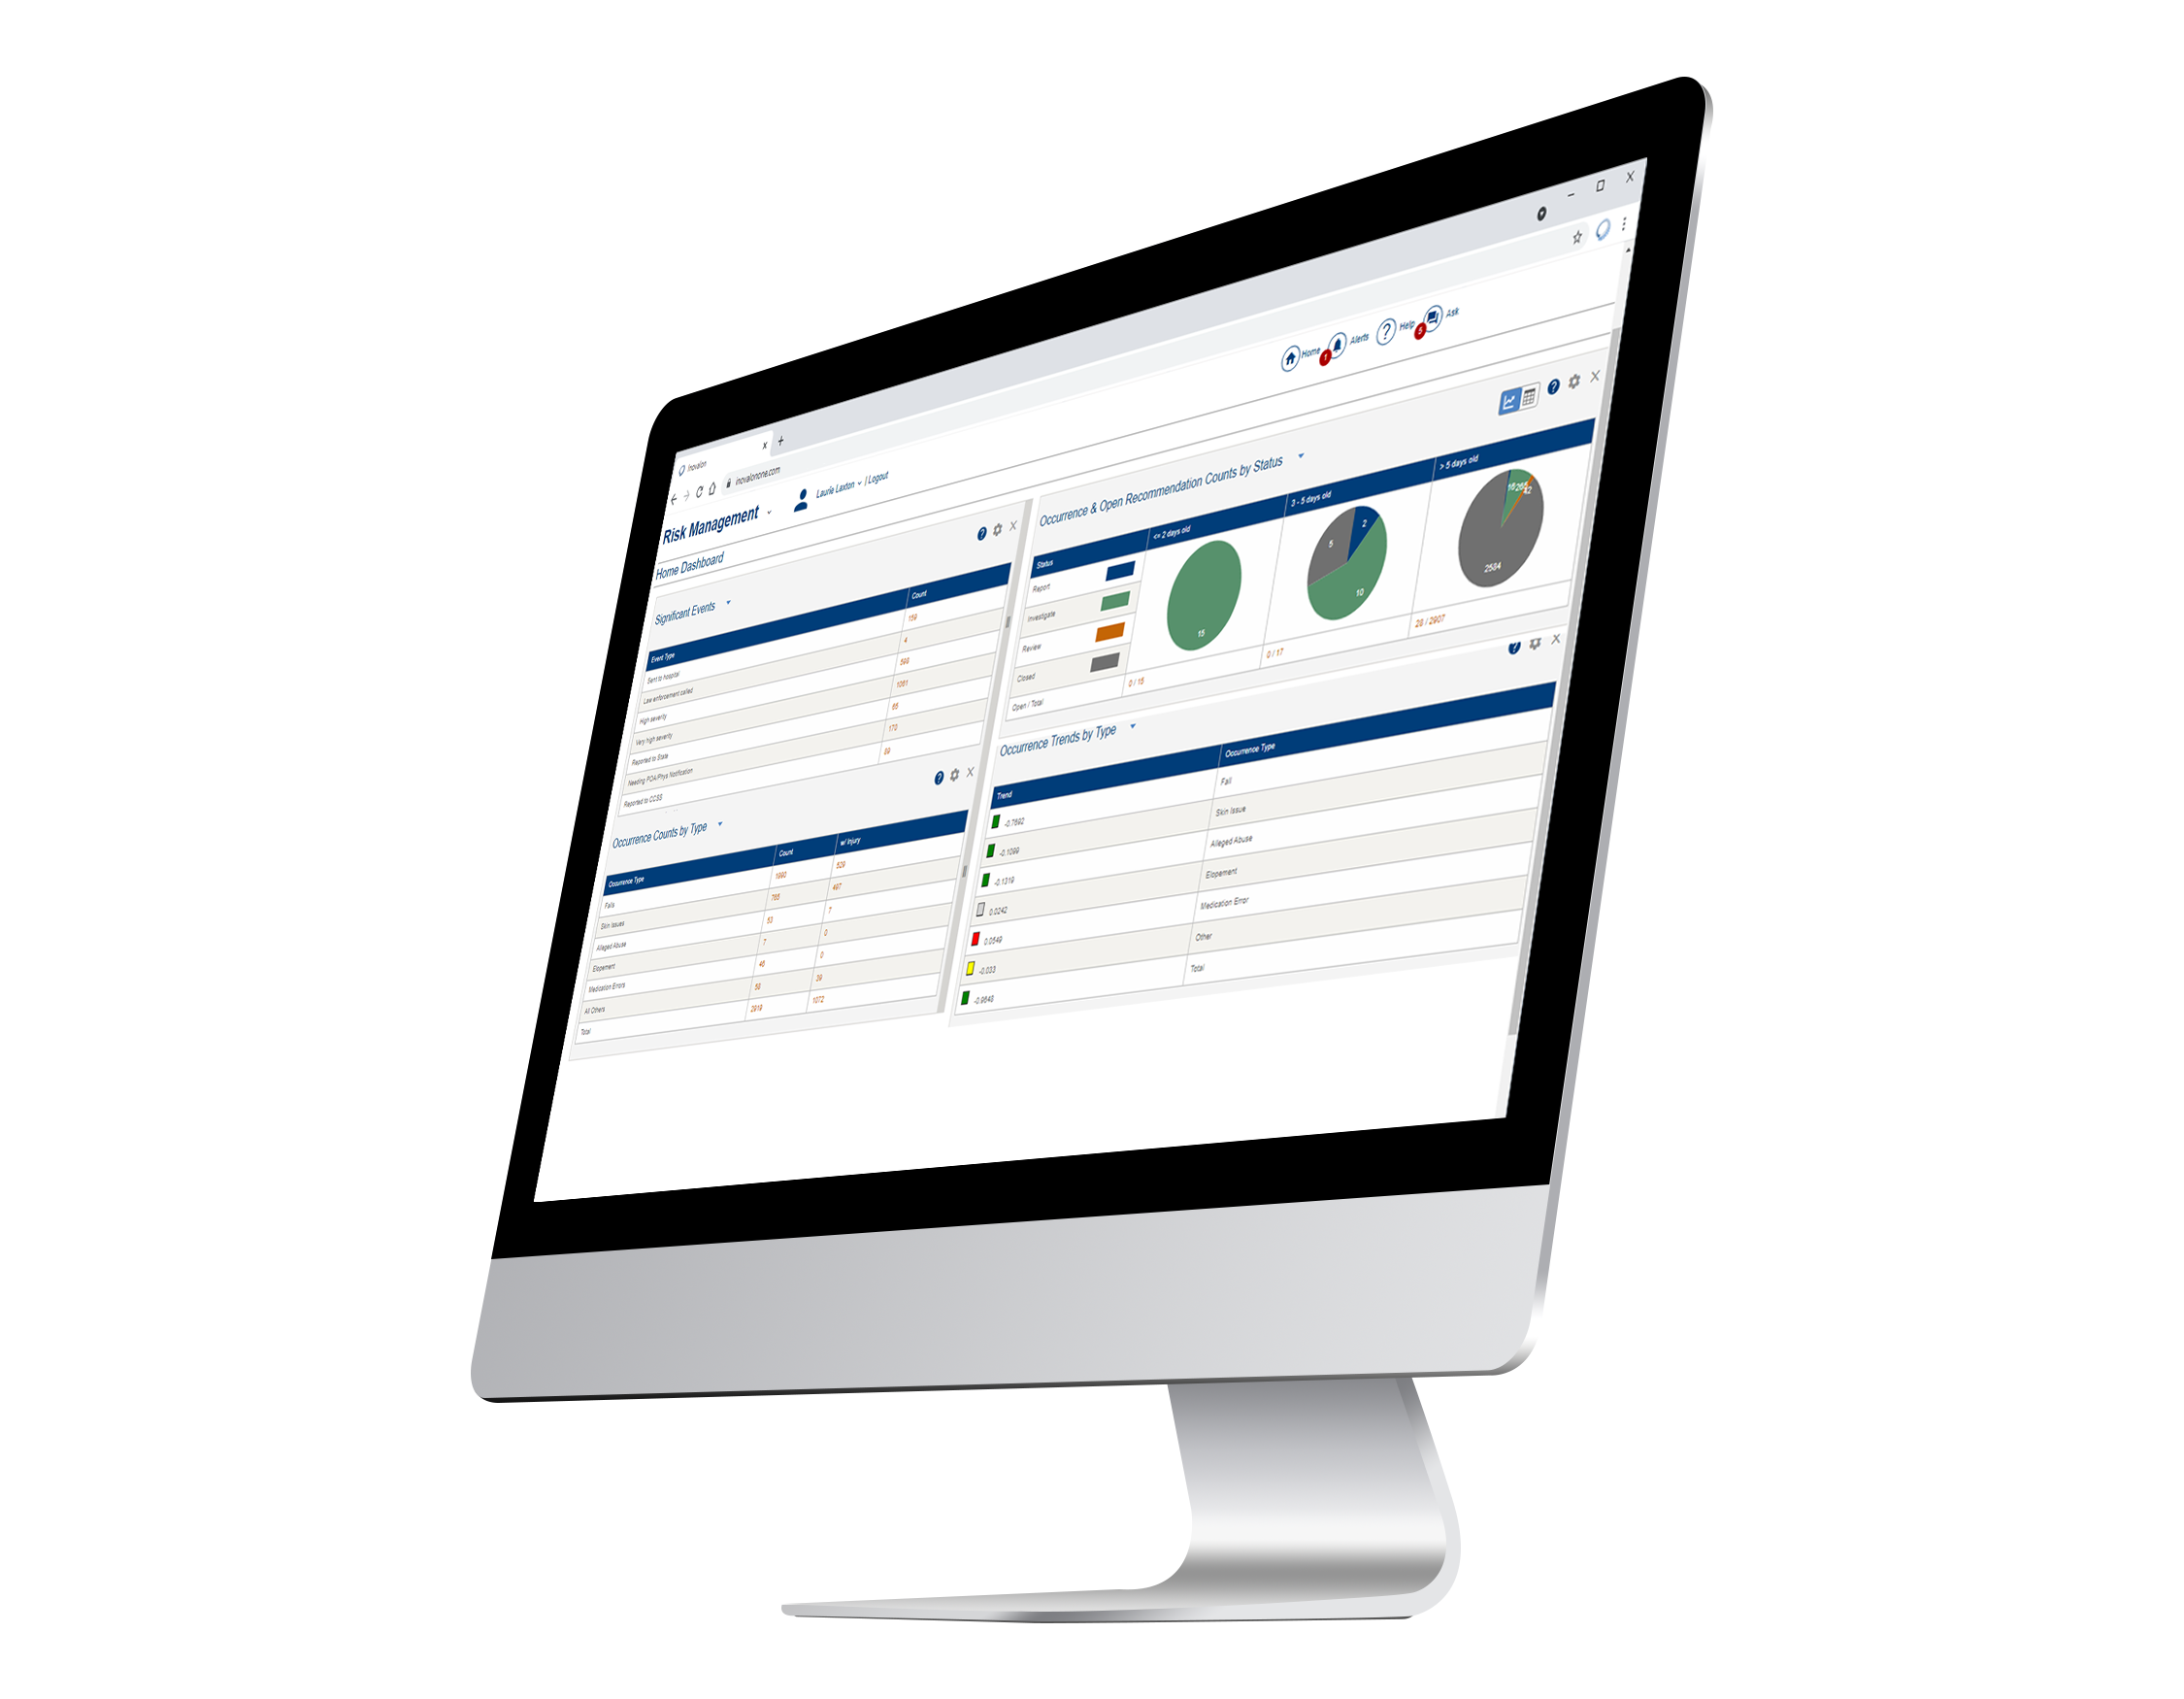
Our solution simplifies safety event reporting so your team can focus on care, not paperwork. It starts with guided, EHR-integrated reporting that makes it easy for staff to capture incidents quickly and accurately. From there, events are automatically routed to the right reviewers, with escalation rules and alerts to ensure nothing is missed.

Once submitted, every event flows through a shared dashboard that connects reporters, investigators, and leaders – providing visibility from the first report to final resolution. Built-in analytics like root cause analysis, 5 Whys, and cause mapping help teams uncover patterns and move from reaction to prevention. And with near real-time insights, your organization can spot trends early, prioritize risks, and take targeted action across any care setting.
TESTIMONIALS

What Healthcare Leaders Are Saying

See how organizations are improving patient safety, reducing harm, and transforming safety event reporting across teams.

“

Inovalon helps us reach more patients and deliver safer care. We’ve been able to do much more with the same team, and the difference in outcomes and efficiency has been clear since day one.

Amber Miller, PharmD, BCPS, BCCCPClinical Pharmacy Coordinator, Antelope Valley Medical Center
“

VigiLanz [Safety Management] is helping us build more robust processes around patient safety by being able to track and trend the data and identify where our problem areas are. It allows us to deep-dive into those risk events and determine where processes are broken.

Kerrie GriffinDirector of Ambulatory Quality Management, CHRISTUS Health
“

Automated event detection saves us a significant amount of time, and gives us more peace of mind that more events are captured. As a result, we can now spend more time analyzing events and identifying improvement opportunities.

Tina Collins, PharmDCorporate Director of Medication Safety, Division of Clinical Excellence, CHRISTUS Health
“

We’re confident that we aren’t missing things and that we’re addressing more potential safety problems and gaps than before.

Danielle Dillon, MHL, BSN, RN, CCRN-KBlood Management Director, Community Health Network
“

Inovalon has given me more time to spend with residents and developing my team. As the director of nursing for an independent continuing care retirement community located in rural Iowa, my team and I are used to wearing multiple hats to keep everything running smoothly. We track our own data and use it to continue to improve our quality, which used to take forever. With MDS Intelligence and Safety Management Starter, tracking trend data to improve outcomes is quick and easy.

Brenda WatersDirector of Nursing, Spurgeon Manor

More Ways to Elevate Care

Explore connected solutions that improve outcomes, reduce risk, and work together in harmony to support safer, more efficient care.

Inovalon Vigilanz Pharmacy Surveillance Product Details Page

Pharmacy Surveillance

Empower pharmacists to anticipate, prevent, and address adverse drug events while improving care.

Inovalon Vigilanz Infection Prevention product details page

Infection Prevention

Prevent harm, improve safety, and enhance patient care with near real-time clinical surveillance.

UB Submission

Submit claims faster and protect revenue with billing software built to manage UB-04 requirements.

Inovalon MDS assessment Intelligence product details page

MDS Intelligence

Simplify MDS accuracy, reduce errors, and stay survey-ready with this MDS assessment software.

Inovalon Quality Management product details page

Quality Management

Spot risks sooner, act faster, and improve patient outcomes before issues escalate with this patient safety and quality management software.

Inovalon audit management product information page

Audit Management

Simplify compliance, protect patients, and reduce risk with powerful patient record audit tools.

Resources

The Impact in Action

Discover what’s working in care management from frontline wins to software that drives results.

  1. Top 25 provider systems based on Becker’s Hospital Review List of 100 Largest Hospitals and Health Systems, December 2024. Inovalon internal reporting, July 2025.
  2. Inovalon internal reporting, April 2025. Inovalon internal reporting. Based on Inovalon’s 2022-2023 Annual Customer Survey results, August 2023.
  3. Inovalon internal reporting, January 2025.